Program
Monday, October 25, 2021
(US Central Time)
| 8:00am – 8:10am |
Opening Remarks (Julien Tierny)
|
| 8:10am – 9:00am |
Keynote Presentation
Professor Alex Telea, Utrecht University
Image-Based Graph Drawing:
From a Million Nodes and Edges to a Million Pixels and Back
Details
|
| 9:00am – 9:30am |
Best Paper
(Session Chair: Julien Tierny)
-
Data-Aware Predictive Scheduling for Distributed-Memory Ray Tracing
Hyungman Park, Donald Fussell, Paul Navratil
|
| 9:30am – 10:00am |
Break |
| 10:00am – 11:30am |
Session: Algorithms
(Session Chair: Filip Sadlo)
-
Fast Approximation of Persistence Diagrams with Guarantees
Jules Vidal, Julien Tierny
-
IExchange: Asynchronous Communication and Termination Detection for Iterative Algorithms
Dmitriy Morozov, Tom Peterka,
Hanqi Guo,
Mukund Raj,
Jiayi Xu,
Han-Wei Shen
-
Trigger Happy: Assessing the Viability of Trigger-Based In Situ Analysis
Matthew Larsen,
Cyrus Harrison,
Terece Turton,
Sudhanshu Sane,
Stephanie Brink,
Hank Childs
-
High-quality and Low-memory-footprint Progressive Decoding of Large-scale Particle Data (Best Paper Honorable Mention)
Duong Hoang,
Harsh Bhatia,
Peter Lindstrom,
Valerio Pascucci
|
| 11:30am – 12:00 pm |
Break |
| 12:00pm – 1:30pm |
Session: Render/Display
(Session Chair: Kelly Gaither)
-
GPU-based Image Compression for Efficient Compositing in Distributed Rendering Applications
Riley Lipinski, Kenneth Moreland, Michael Papka, Thomas Marrinan
-
Amortised Encoding for Large High-Resolution Displays
Florian Friess,
Michael Becher,
Guido Reina,
Thomas Ertl
-
Portable and Composable Flow Graphs for In Situ Analytics
Sergei Shudler,
Steve Petruzza,
Valerio Pascucci,
Peer-Timo Bremer
-
An Entropy-Based Approach for Identifying User-Preferred Camera Positions
Nicole J Marsaglia,
Yuya Kawakami,
Samuel David Schwartz,
Stefan Fields,
Hank Childs
|
| 1:30pm – 2:00pm |
Break |
| 2:00pm – 3:20pm |
Early Career Researcher Lightning Talks
(Session Chair: Chaoli Wang)
- James Kress: In-Line vs. In-Transit In Situ: Which Technique to Use at Scale?
- Jun Han: Deep Learning for Scientific Data Representation and Generation
- Sam Molnar: Metropolitan-Scale Power Grid Analysis: Geospatial Networked Time Series Data with Hierarchical Structure
- Takanori Fujiwara: Approaches and Challenges in Visual Analytics of Streaming High-dimensional Data
- Victor Mateevitsi: SENSEI, Scalable in situ analysis and visualization
- Sudhanshu Sane: Exploratory Time-Varying Flow Visualization via Lagrangian Representations
|
| 3:20pm – 3:30pm |
Best Paper Awards (Johanna Beyer)
Closing Remarks (Kristi Potter)
|
Keynote
Image-Based Graph Drawing: From a Million Nodes and Edges to a Million Pixels and Back
Professor Alex Telea, Utrecht University, Netherlands
Visualizing large, multivariate, and time-dependent graphs is one of the grand challenges of information visualization. In recent years, image-based techniques have emerged as a powerful instrument to handle the visualization of big datasets. Yet, how these techniques, well proven for exploring data in scientific visualization and imaging, can be adapted to handle graph data, is still an open point. In this talk, I aim to provide the missing link between scivis, imaging, and graph visualization. I will explore the characteristics of scivis and imaging data that make it inherently amenable to multiscale visualization approaches, and next outline several directions by which graph data can be brought to the same form, thereby inheriting the desired scalable visualization options. Next, I will propose a taxonomy of multiscale graph visualization methods centered around the image-based approach. Examples will illustrate the added-value of image-based visualization of graphs from several domains. Finally, I will outline the open challenges of image-based methods for visualizing high-variate and time-dependent graphs.
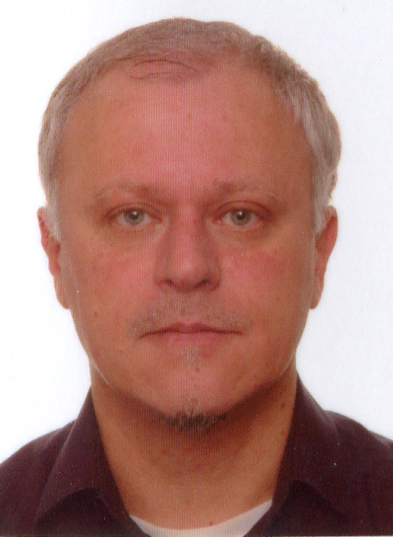
Speaker
 Alexandru C. Telea received his PhD (2000) in Computer Science from the Eindhoven University of Technology, the Netherlands. He was assistant professor in visualization and computer graphics at the same university (until 2007) and then full professor of visualization at the University of Groningen, the Netherlands. Since 2019 he is full professor of visual data analytics at Utrecht University, the Netherlands. His interests include high-dimensional visualization, visual analytics, and image-based information visualization. He is the author of the textbook “Data Visualization - Principles and Practice” (CRC Press, 2014).
Posters
TBA.

 Alexandru C. Telea received his PhD (2000) in Computer Science from the Eindhoven University of Technology, the Netherlands. He was assistant professor in visualization and computer graphics at the same university (until 2007) and then full professor of visualization at the University of Groningen, the Netherlands. Since 2019 he is full professor of visual data analytics at Utrecht University, the Netherlands. His interests include high-dimensional visualization, visual analytics, and image-based information visualization. He is the author of the textbook “Data Visualization - Principles and Practice” (CRC Press, 2014).